2020: What Just Happened? Pt.5
4 Economic Indicators to Watch
The Economic Trends that Explain the Market’s Optimism
Part of the series: 2020: What Just Happened? A Stock Market Untethered
Just a reminder: Economic Indicators are data signal that help us measure the health of the US economy.
In terms of economic indicators, 2020 was a year of true superlatives. Many indicators simply broke records in terms of drops in March and gains during summertime re-openings. Below we’ll look at 4 high impact indicators that tell us more about what happened in 2020, and could also help signal where we’re heading:
- Gross Domestic Product
- Unemployment Rate
- Consumer Sentiment Index
- US New/Existing Homes Sold
Gross Domestic Product (GDP)
As the sum of value created by the production of goods and services within the US in a given period, GDP is a lagging (after the fact) indicator that helps investors gauge the growth rate of the economy. Since 1948, US GDP has grown quarterly at an annualized rate of 3.16%.
However, this rate slowed 2000 onward to approximately ~2%. At the start of 2020, the US economy totaled nearly $19.5 trillion — it dropped to a low of $16.5 trillion on 6/30/2020 for the trailing twelve months (June 2019 through June 2020).

In Q2 2020, GDP dropped by a record -31% with much of the economy shuttered due to “shelter-in-place” orders. Compare this to a max drop of -8.4% during the height of the Great Recession in 2009.
As businesses and states reopened in Q3 2020, GDP largely rebounded, growing 33%. But even with this jump, the total value of the US economy is still below pre-recession levels by -3.4%.
Heading into 2021, economists predict a surge of GDP growth, with the US perhaps emerging from recession by the latter half of the year. But many states have had to reinstitute widespread shutdowns in late Q4 2020 in order to contain the second wave of COVID-19. This headwind will likely hamper GDP growth again, raising the risk that the recession could protract into 2022.
Unemployment Rate
The US Unemployment Rate is a lagging indicator that measures unemployed people (as a percentage of the total possible workforce) who are actively looking for work in the US. Unemployment Rate usually spikes during recessions, and recedes quickly during recovery periods. Over the past 20 years, the unemployment rate has averaged 5.35%, and during the Global Recession of 2009, unemployment jumped to around 10%. It took about 8 years to recover to pre-Great recession levels.

In Q2 2020, with mass layoffs and furloughs, millions of American workers filed for unemployment at an unprecedented rate. In April 2020, the unemployment rate jumped to 14.7%, but has sharply declined as states have gradually re-opened and businesses have hired back their workers.
By November 2020, the Unemployment Rate dropped to 6.7%, which is a drastic improvement over Q2. However, the rate is still above historical averages, and far greater than the 3.5% rate right before the pandemic started.
Looking ahead to 2021, initial claims for unemployment, which is a leading (predictive) indicator for the unemployment rate, have stayed alarmingly elevated. With a new wave of lock downs, initial claims have averaged 800k on average in Q4 2020, about 2.5x the average from 2010–2019.
Consumer Sentiment Index (CSI) / US Retail Sales (USRS)
Both CSI and USRS are indicators that measure consumption in the US. As the US has shifted away from a manufacturing-based economy to a goods and services-based economy, CSI and USRS have become important indicators to measure the overall health of the US economy. USRS is a dollar measure, while CSI is based on user surveys normalized against a consumer sentiment starting value of 100 in December 1966.
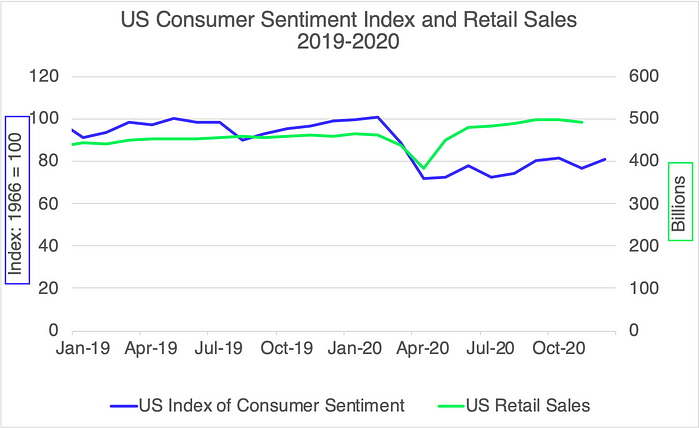
In Q2 2020, both CSI and USRS dropped precipitously, as unemployment jumped and consumers feared going out to shop and dine, opting rather to save in the face of a recession. However, despite earlier trepidations, US consumers have slowly regained their willingness to spend. Consumer Sentiment has started to recover steadily from a low of 72 in April to a score of 81 in November, during the buildup to the Holiday Season.
Surprisingly, US Retail Sales actually jumped from a March low of $382 billion in monthly spending to nearly $500 billion being spent in September. Septembers retail spending even surpassed pre-pandemic levels. Economists largely attribute this surprise to pent up demand and many households making large value purchases that they held off on in Q2.
However, much of this spend has been on goods, rather than services, and there is only so much “stuff” that consumers can buy. Heading into 2021, retail spending on services, not just goods, needs to recover in order for the US to emerge from recession.
Housing Sales (New and Existing)
Housing Sales, both for new and existing homes are lagging indicators that measure the number of houses sold in a year on a monthly rolling basis.
For many Americans, buying a house represents the single largest investment they will make during their lifetimes. Increased housing transactions (and increased prices) can indicate that American households are feeling confident about their economic prospects and also buoy other large purchases, such as home furnishings and construction materials.
Over the past decade, Americans purchased an average of 531 thousand newly constructed homes and 5.1 million existing homes in a rolling year.
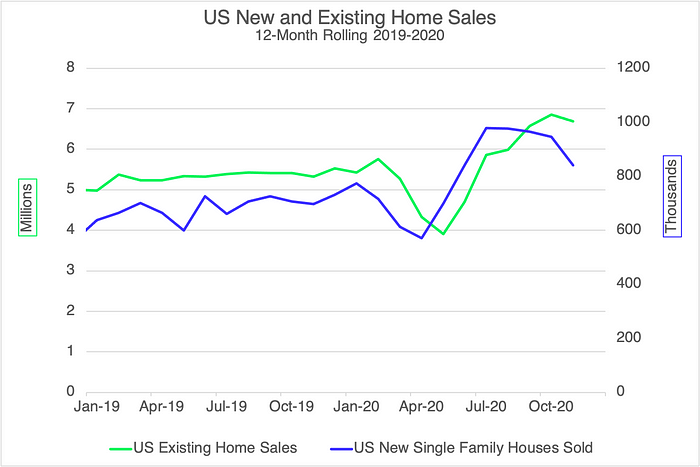
At the start of the year, home purchases were already elevated above historical averages. Yet, despite a brief pull back in Q2 2020, Americans went all in on home purchases during the second half of 2020. “Work From Home” and historically low mortgage rates fueled appetites to buy a home and relocate, even in the midst of the Pandemic.
As a result, new family home sales rose to nearly 979 thousand in July for the previous year, while existing home sales climbed to a staggering 6.8 million in October for the previous year. While this elevated market for home purchases is still below the frenzied run up to the housing crisis in the mid-200s when American bought 7+ million homes in 2005, it’s remarkable given the backdrop of a widespread wave of evictions.
Heading into 2021, what remains to be seen is the propensity of Americans to keep up this rate of home buying. While mortgage rates have never been lower, median home sale prices have been climbing, which may turn away would be buyers. And frankly, there are only so many homes that Americans can buy.
Up Next
2020: What Just Happened? Pt. 6: Keynesian Economics Triumphant — Government Spending our way out of a Pandemic

